Magic Millions Book One is Australia’s biggest sale and the first sale, with nearly a thousand horses selling from $20,000 to $3.2million so we’ve taken a look at how the top, middle and lower markets fared in this vital barometer.
The economy of course has been dominated in recent years by high inflation, rising interest rates and cost of living pressures and that certainly took some bite last year in parts of the market.
On the positive side of late, inflation has eased and, while interest rates haven’t, they appear to have peaked, with optimism the next moves will be down.
The stock market during that period has remained quite buoyant, growing at better than seven percent for the last three years and that’s always an indicator for the top end.
For the purposes of this exercise we’ve used the top 20% of sales as the top end of the market, the bottom 20% as the lower end and the 60% in between as the middle market.
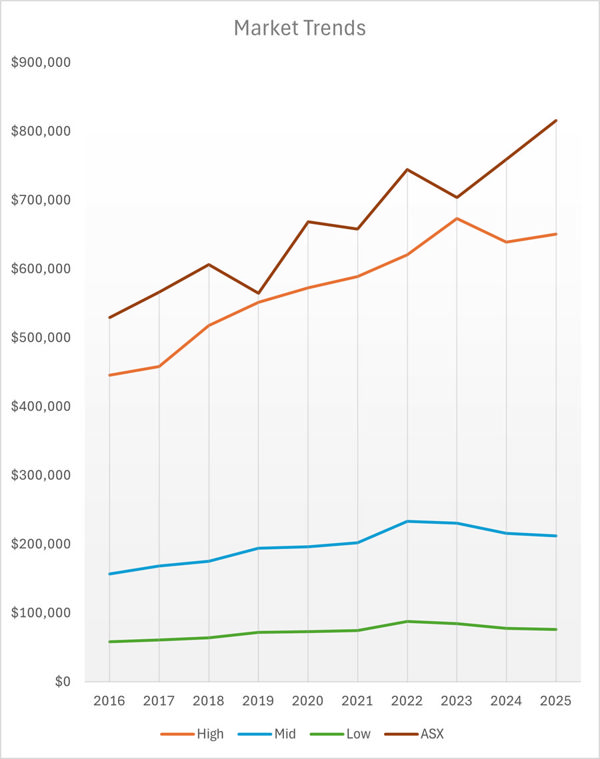
Here are the Magic Millions Gold Coast figures sorted into those segments on average price.
|
Year |
Top |
Mid |
Low |
|
2016 |
$445,702 |
$156,684 |
$58,153 |
|
2017 |
$457,993 |
$168,450 |
$60,899 |
|
2018 |
$517,815 |
$175,306 |
$64,128 |
|
2019 |
$551,713 |
$193,936 |
$72,038 |
|
2020 |
$572,745 |
$196,020 |
$73,024 |
|
2021 |
$588,920 |
$202,124 |
$74,418 |
|
2022 |
$620,801 |
$233,126 |
$87,946 |
|
2023 |
$673,166 |
$230,320 |
$84,441 |
|
2024 |
$638,779 |
$215,595 |
$77,471 |
|
2025 |
$650,682 |
$211,848 |
$76,074 |
Top End
The top end reached its latest zenith in 2023 when yearlings averaged $673,166 and came off by 5% last year to $638,779.
However, this year saw a recovery to the tune of 1.9% to an average of $650,682.
That doesn’t seem much, but considering the rest of the market it’s noteworthy.
What also is noteworthy is the correlation between the top end of the yearling market and stock market as the below chart shows.
Middle Market
The middle market saw its latest peak in 2022, a year earlier than the top end.
In 2022 the Gold Coast yearlings in this sector averaged $233,126 and it’s been downhill since, falling 1.2% in 2023 and then lost an uncomfortable 6.4% last year.
It’s fair to say there was certainly some uncertainty and concern about how the middle would hold up in 2025, and while it fell further by 1.7%, to an average of $211,848, that figure would be taken by most to be a positive.
Lower End
This sector has followed the middle market, however with a more serious bite being taken out of the downhill trend in recent years.
Like the middle, the lower end had its latest peak in 2022 when averaging $87,946.
In 2023 it lost 4%, a tougher result, and last year shed another 8.3%, again significantly harder hit.
However, like that middle market, this sector was down again this year to an average of $76,064 which, as a 1.8% loss, would probably be at the positive end of hopes.
What to make of it
Overall you’d think it was a good result which Magic Millions would be rightly pleased with.
With an average of $271,000 and median of $200,000, it’s virtually identical to 2024 with some buoyancy at the top end and a steadying below.
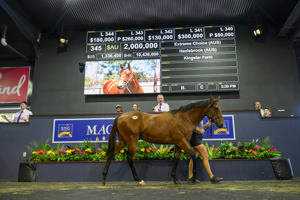
It’s interesting to note that there were only 13 million dollar yearlings in 2025 compared to 23 in 2024, however the average at the top still increased.
The middle market is where most of the industry operates to turn a profit. At the current average of a bit above $200,000, that’s about $10,000 per five percent share for buyers onselling and a profit for those selling.
It probably creates a scenario this year where buyers and sellers are both going to get their fair crack at the upcoming Classic and Premier Sales.
The lower end, while running to the same trend of the middle, takes the bad times harder and it’s tough not to imagine that the immensely popular digital sale market isn’t going to have an ongoing impact on that buying bench.